ChartPixel
Unleash AI-driven data visualization and analysis, effortlessly, with ChartPixel.
About ChartPixel
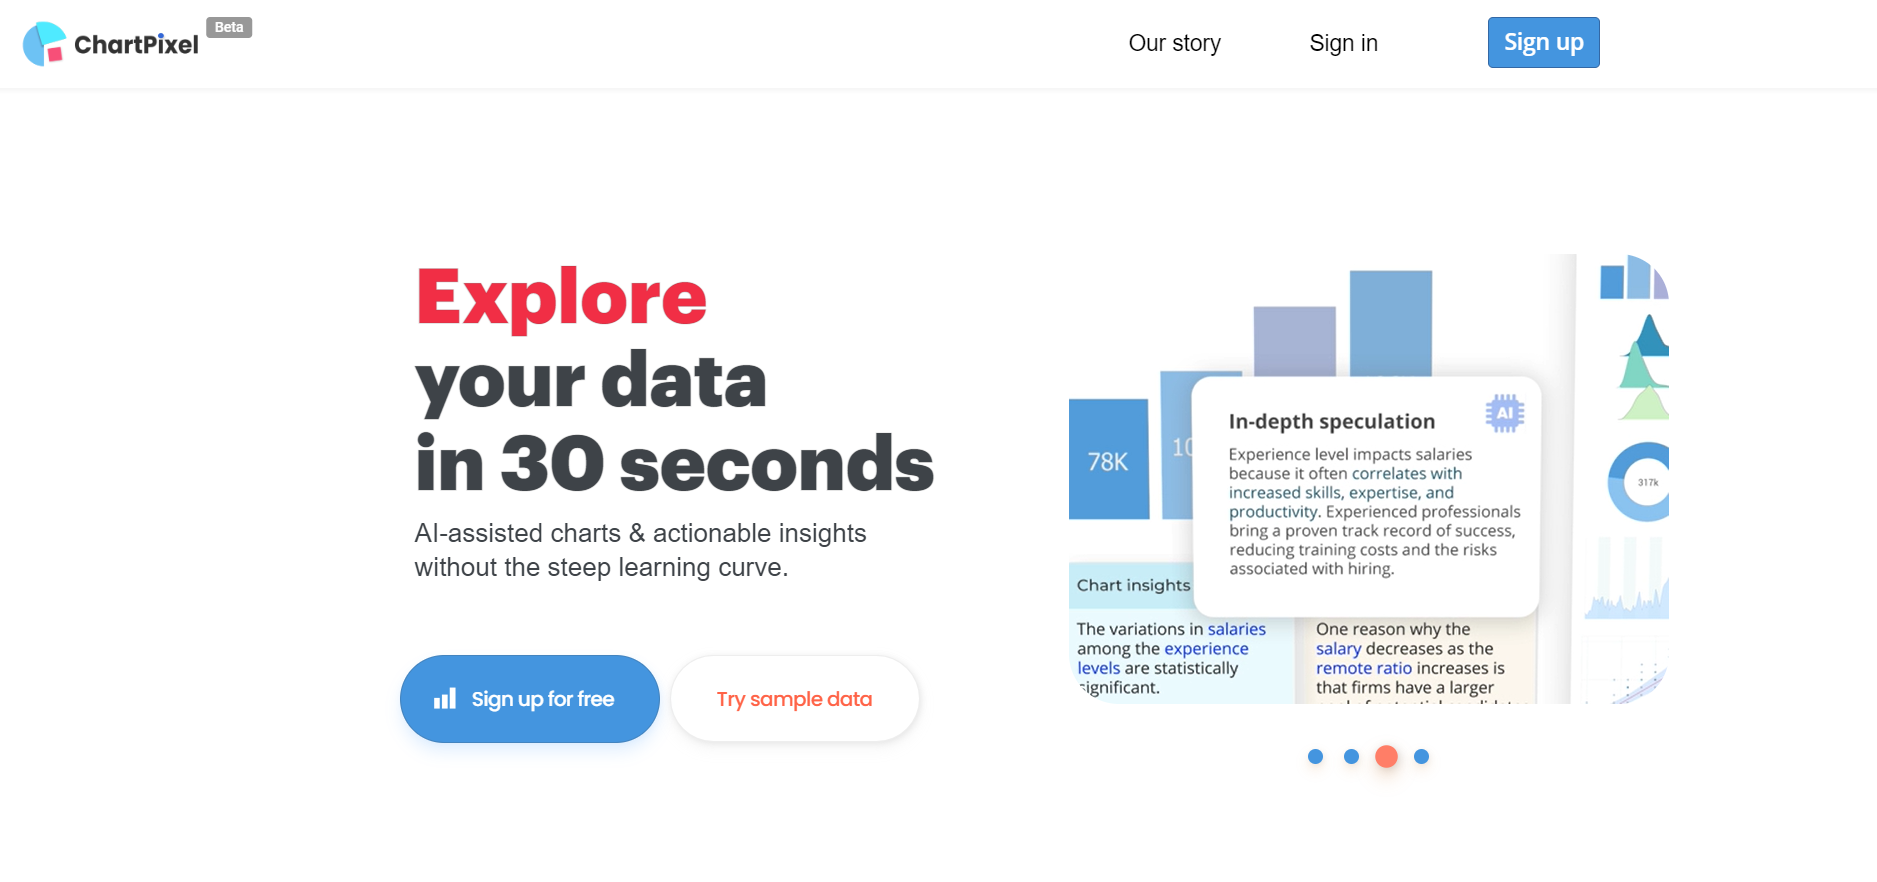
ChartPixel is an innovative AI-powered tool that transforms the way we interact with data. In the digital age, where data is the new currency, ChartPixel stands out as a beacon for those looking to harness the power of their data quickly and effectively. It promises to generate charts and insights within a mere 30 seconds, offering a streamlined solution for data visualization and analysis. Designed for a wide array of users, from students to seasoned professionals, ChartPixel aims to simplify the often complex process of data interpretation.
Key Features
- User-Friendly Interface: The platform boasts an intuitive interface that caters to users of all skill levels, ensuring that data analysis is accessible and not daunting.
- Smart Data Cleaning: It takes the hassle out of preprocessing by cleaning messy data and engineering new features for a comprehensive analysis.
- Insightful Annotations: With AI-assisted annotations and statistics, ChartPixel not only presents data visually but also explains it, making patterns and trends easier to grasp.
- Versatile Data Input Options: ChartPixel allows users to upload data from various sources, including Excel, CSV files, and even directly from webpages via keyword searches or URLs.
Pros
- Time-Saving: It significantly reduces the time spent on data visualization by automating the creation of charts and insights.
- Educational Tool: Serves as an educational platform for those new to data analysis, eliminating the need to learn complex software or coding.
- Presentation-Ready Output: Charts and insights can be exported directly into presentation formats like PowerPoint, streamlining the workflow from data to delivery.
- No Data Expertise Required: ChartPixel is designed to be intuitive, allowing users with little to no data analysis background to generate and understand data visualizations.
Cons
- Beta Stage Limitations: Being in a beta phase, users might encounter certain limitations in features or occasional bugs that are typically addressed as the tool evolves.
- Dependence on AI Interpretation: The insights generated are AI-driven, which may not always align with the user's specific analytical perspective or needs.
- Learning Curve for Advanced Features: While the tool is user-friendly, some users may require time to fully utilize its more advanced features and capabilities.